FAIRS
23.-25. Januar 2026
Antiquariatsmesse Stuttgart 2026
Liederhalle, Schillersaal
Stand 47
FAIRS
23.-25. Januar 2026
Antiquariatsmesse Stuttgart 2026
Liederhalle, Schillersaal
Stand 47

Antiquariatsmesse Stuttgart 2026
Liederhalle, Schillersaal
Stand 47
Antiquariatsmesse Stuttgart 2026
Liederhalle, Schillersaal
Stand 47

„Infographics and data visualizations have become such a part of public life that it’s difficult to imagine navigating our tumultuous times without them. But despite their intuitive power, their basic building blocks – the bar chart, the pie chart, and the line graph – did not simply spring, fully formed, into the public consciousness. They were invented by a man who was, himself, something of a statistical outlier – a boundary-thwarting, Enlightenment-era, near-criminal rascal named William Playfair.
Playfair’s particular skills and viewpoint made him uniquely equipped to buck the trends of his time, even as he invented a way to illustrate them. Today, graphs and charts are seen as more efficient than words, letting us gulp information rather than sip it. For a large chunk of European history, though, this was far from the case. As statistician Howard Wainer explains in Graphic Discovery: A Trout in the Milk and Other Visual Adventures pp. 25, 18th century academics actually looked down their noses at anything that resembled a picture.“
“Readers were accustomed to persuasion by rhetorical means,” Wainer writes – well-written arguments, perhaps spruced up by a table or two, would get educated people on your side. Illustrations, in contrast, were thought of as inaccurate “trifles,” suited more for working through arguments than for presenting them. There were technical barriers as well: scientists, economists, and others who might have sketched out hasty graphs for their own edification often lacked the necessary artistic skills to engrave them into plates for publication, writes Wainer. Into this void stepped Playfair, a man with very little regard for tradition. Born in Scotland in 1759, Playfair was a kind of Forrest Gump of the Enlightenment, rubbing shoulders with the era’s many giants, switching careers at the drop of a hat, and throwing himself headlong into history-changing events, from the storming of the Bastille to the settling of the American West.“ (Cara Giaimo at blog: Atlas obscura, 28. June 2016)
„In 1786, the Scottish engineer and economist William Playfair (1759–1823) started to use innovative diagrams, line graphs and bar charts in oder to illustrate basic facts, mostly from the realm of economics and „political arithmetic“ (what would nowadays be called the social sciences). By 1801, he had enriched this inventory of graphic representations by pie charts to represent percentages and proportional relations. Several of these graphic displays have become so standard today in commerce and trade that it is hard to realize how brilliantly innovative those graphical means were at the time, to represent complex issues in the simplest terms.“ (Hentschel. Visual cultures … 2014. pp. 49)
„Over the course of the next half century, Playfair’s line graph, which counterposed two quantitative axes, (one for time, the other for economic measures such as exports, importants and debts) became on of the most recognizable chronographic forms.“ (Rosenberg & Grafton, Cartographies of Time (2010) pp. 136).
PLAYFAIR, William.
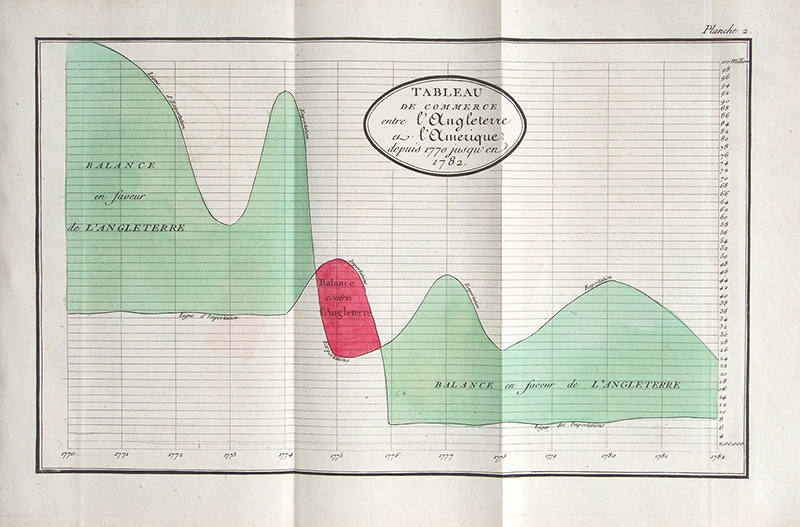
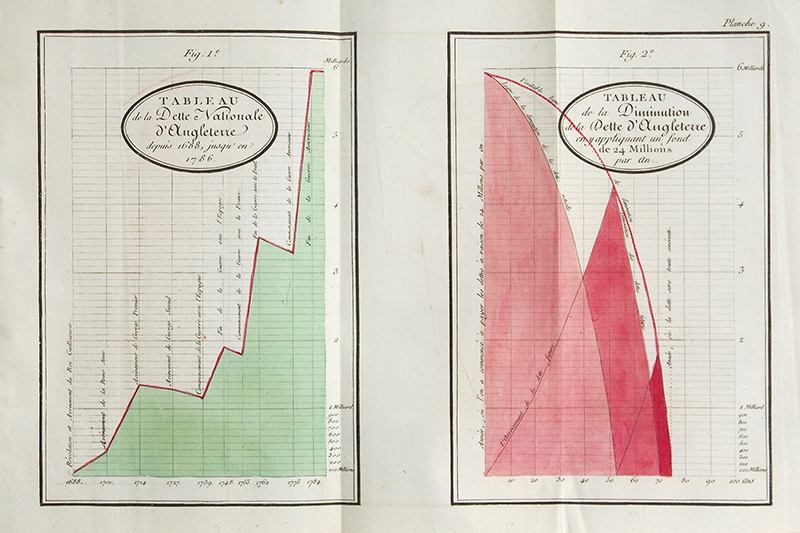
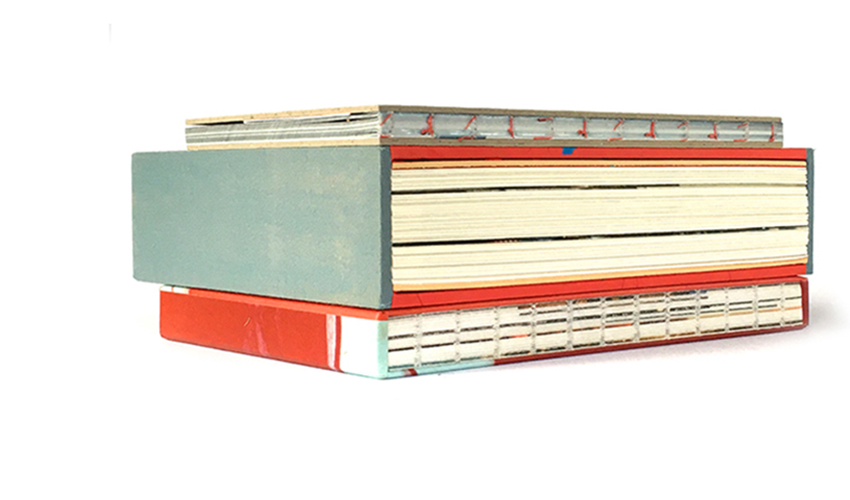
Tableaux d’ arithmetique lineaire, du commerce, des finances, et de la dette nationale de l’ Angleterre par M. W. Playfair. Suivis d’ un Essai sur la meilleure maniere de faire des emprunts publics; d’ après la compa-raison des emprunts perpétuels & des annuités de quinze années, en Angleterre. Par le meme auteur, le tout traduit de l’ anglois (by Henrik Jansen).- A Paris: chez Barrois l’ainé, 1789. 4to (245 x 200 mm) (XV), (1), 87 pp., (1) with twelve fold. engraved, colored plates. Period style half calf, clean and fresh copy with fine contemporary coloring. Very fine.
Very rare first French part translation of Playfair’s ‚The commercial and political atlas‘ and of ‚An essay on the national debt‘ (1787): the charts are preceded by detailed information on the commerce and revenue of Britain.
„William Playfair was the first to devise and publish several different types of statistical chart (most notably the time-series line graph, the bar chart, the pie chart and the circle chart). Although one may point to isolated instances of earlier diagrams that might be considered to be statistical, the publication of statistical graphs began with William Playfair in 1786. Playfair was aware of how and why his charts were effective devices for communicating data. He had an intuitive, but clear, understanding of the psychology of graph reading and many of his ideas anticipate the findings of modern experimental psychology. Playfair understood that statistical charts could assist human information processing by reducing demands on attention, working memory, and long-term memory. … With the appearance of the ‚Commercial and Political Atlas (1786) statistical time-series line graphs are seen in essentially the same form as today. The plates in the Atlas contain all of the elements that we take for granted in modern time-series graphs: graduated and labeled axes, grid lines, a title, labels, lines indicating changes in data over time, color to categorize the different time series and accumulated quantities, etc.“ (Ian Spence)
Playfair was an engineer and political economist remembered primarily for his innovations in the presentation of quantitative information by means of graphs and charts. He invented the time series graph or line chart, the bar chart, and the pie chart. In 1785 Scottish engineer and political economist William Playfair issued in London a privately circulated preliminary edition of his „The Commercial and Political Atlas; Representing, by Means of Stained Copper-Plate Charts, the Exports, Imports, and General Trade of England, at a Single View“. The next year Playfair formally published the work in London with an even longer title. For this work Playfair invented the line chart or line graph or times series plots, present in the english book in 43 variants, and the bar chart or bar graph, represented by a single example. The first 10 plates of the english edition were engraved by Scottish engraver and cartographer John Ainslie in 1785 for the preliminary edition; the remainder were engraved by Samuel John Neele (here by Pillot). It is thought that Playfair, often short of funds, may have hand-colored the charts himself – the coloring process that he curiously designated as „staining“ in the titles. As one inspiration for his information graphics concerning economics and finance, Playfair cited Priestley’s timelines as published in his New Chart of History.
„Playfair had a variety of careers. He was in turn a millwright, engineer, draftsman, accountant, inventor, silversmith, merchant, investment broker, economist, statistician, pamphleteer, translator, publicist, land speculator, convict, banker, ardent royalist, editor, blackmailer and journalist. On leaving Watt’s company in 1782, he set up a silver-smithing business and shop in London, which failed. In 1787 he moved to Paris, taking part in the storming of the Bastille two years later. He returned to London in 1793, where he opened a „security bank“, which also failed. From 1775 he worked as a writer and pamphleteer and did some engineering work.“ Palsky. Des Chiffres et des Cartes. La cartographie quantitative au XIXe siecle. (1996), pp. 53; Tufte sale no. 60; Goldsmiths- Kress no. 13787; Kress B. 1694; OCLC 2291251.